Community Art Project with Lize Mogel: Session 3
Feb 3, 2015
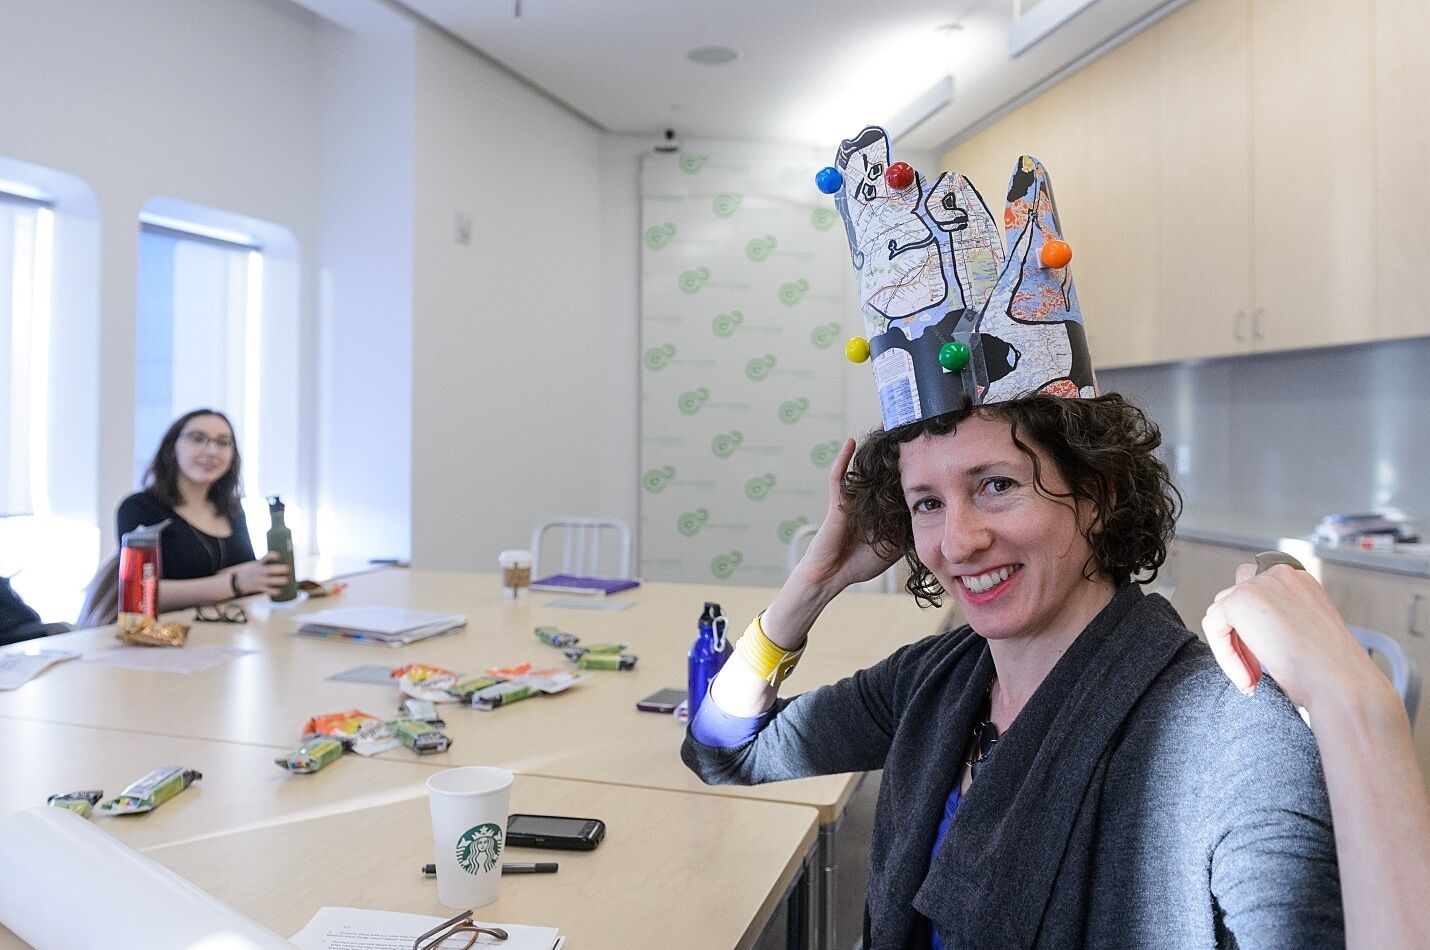
On February 3, YI Leaders met with artist Lize Mogel to complete their mapping project. It also happened to be the artist’s birthday! After celebrating with singing, cupcakes, and map hats, Mogel presented the idea that maps tell a story, and our project for this session was to discuss and finalize our stories of the Chelsea and Meatpacking neighborhoods.
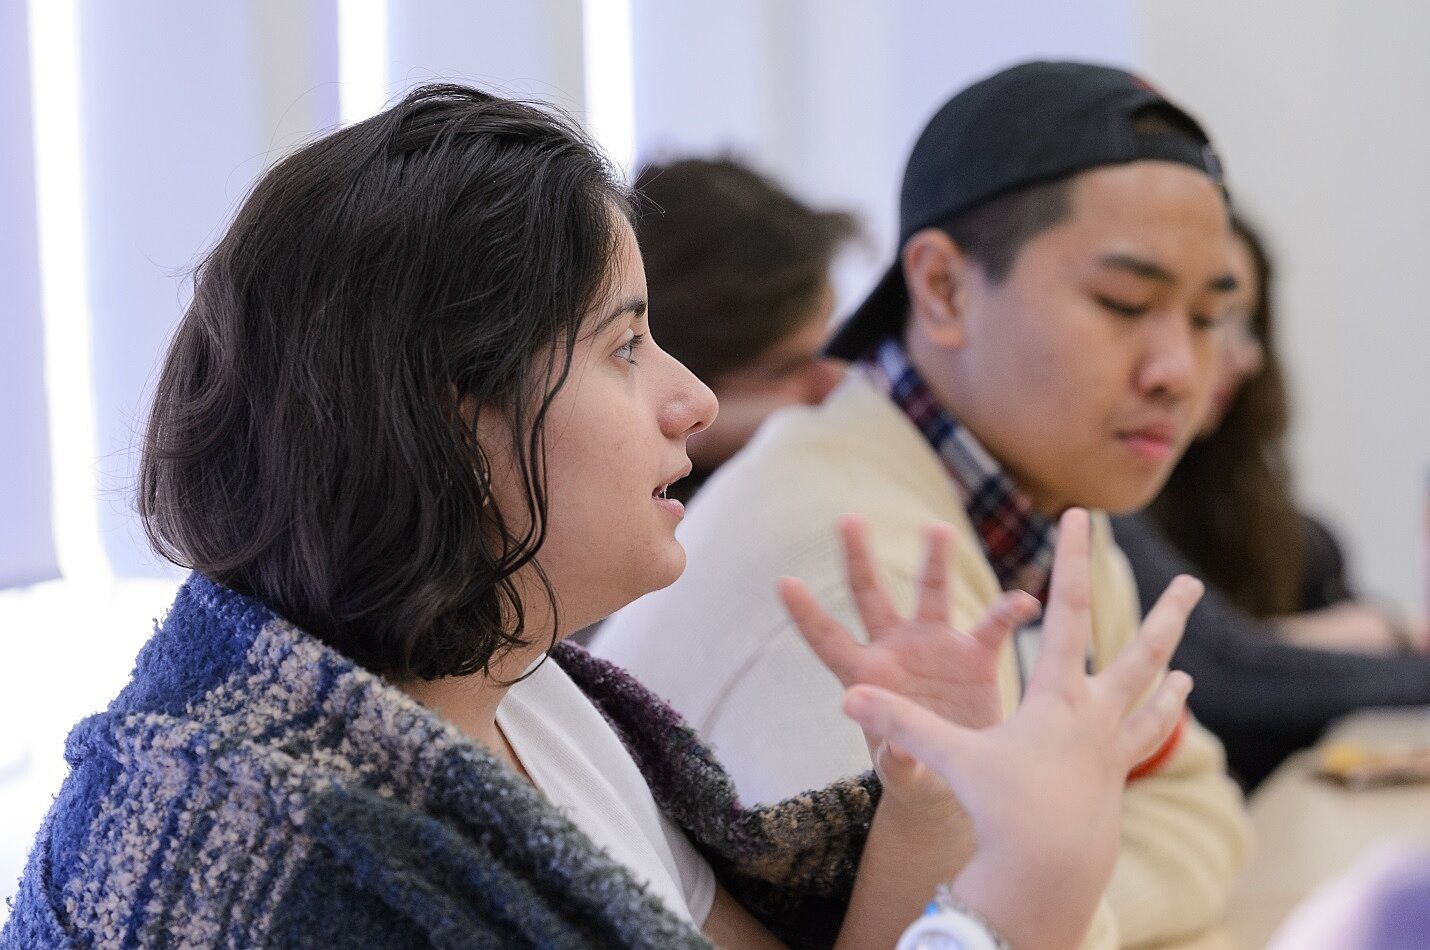
YI Leaders discussed their topic of choice and what they had found out while tracking the neighborhood in the previous session. Michael and Logan discussed mapping bikes and how their location might correlate with the social and economic environment of the area. They talked about the thought involved in deciding where to lock up one’s bike. Krystal talked about why some areas had more fire escapes than others. Carlo mapped doors that don’t have any type of handle on the exterior of the building. Anna documented the number of empty spaces in the area designated by ‘For Rent’ signs on glass storefronts. Holly recorded where the cobblestone streets meet with pavement and gravel as well as the relationship between where the two meet and their possible meanings. I mapped coffee shops that aren’t Starbucks, their price points, and the location of these shops.
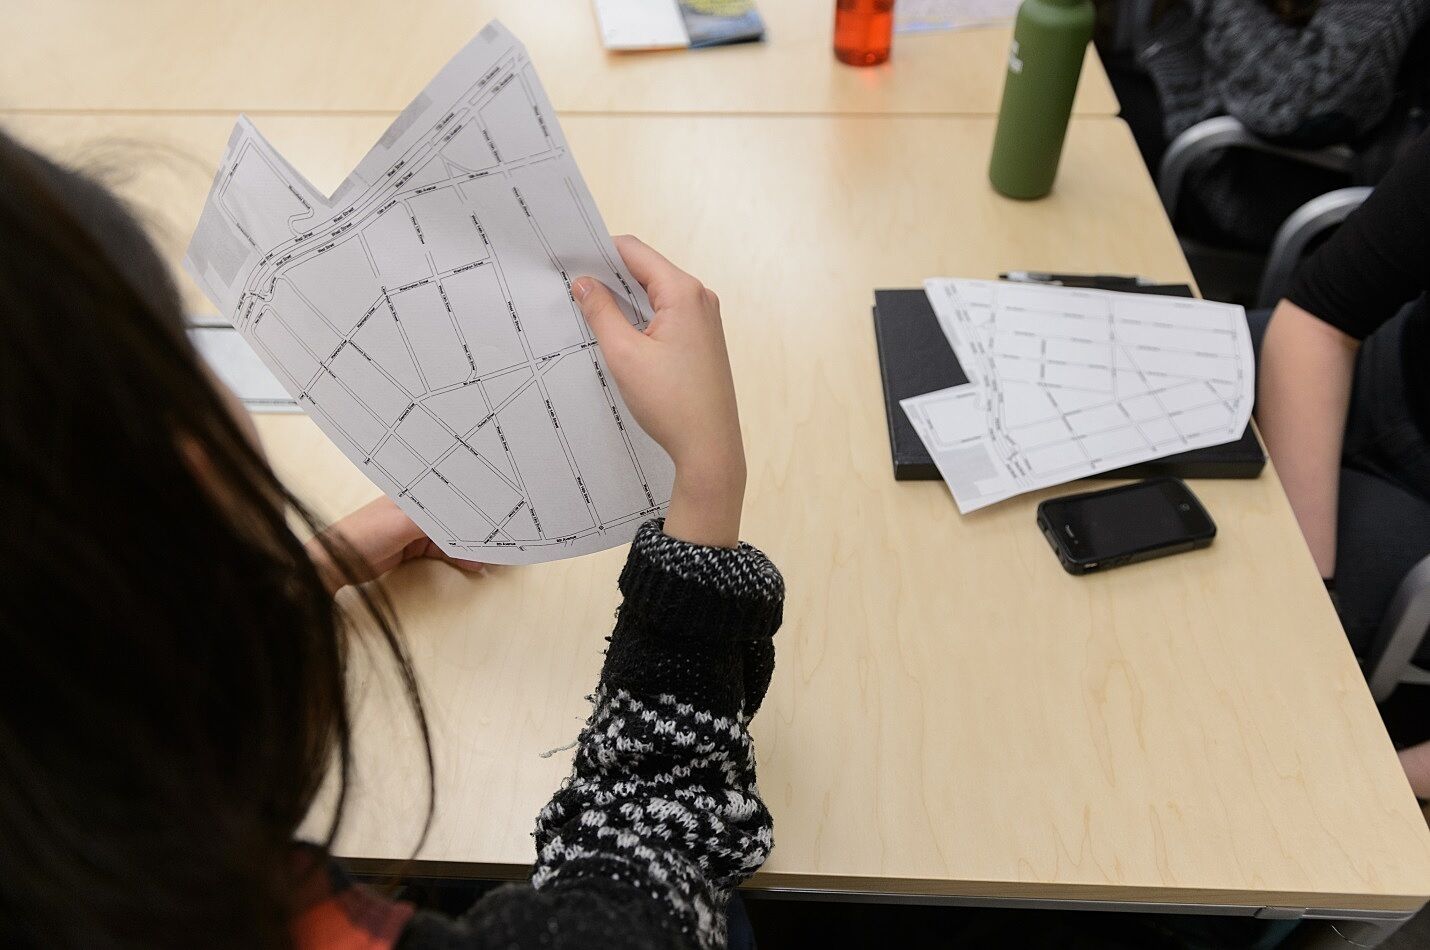
As told by Mogel, maps are visual aids that not only document geographic space and location, but also serve as visual storytellers. We often limit ourselves to perceiving maps by their traditional purpose: a representation of a certain area to get us from point A to point B. Mogel stressed that maps can be anything, including the location of bird chirps or types of rooftops, but they should have a certain level of integrity. We naturally trust maps to contain all the essential information, to be efficient, and to be visually stimulating in order to convey their message.
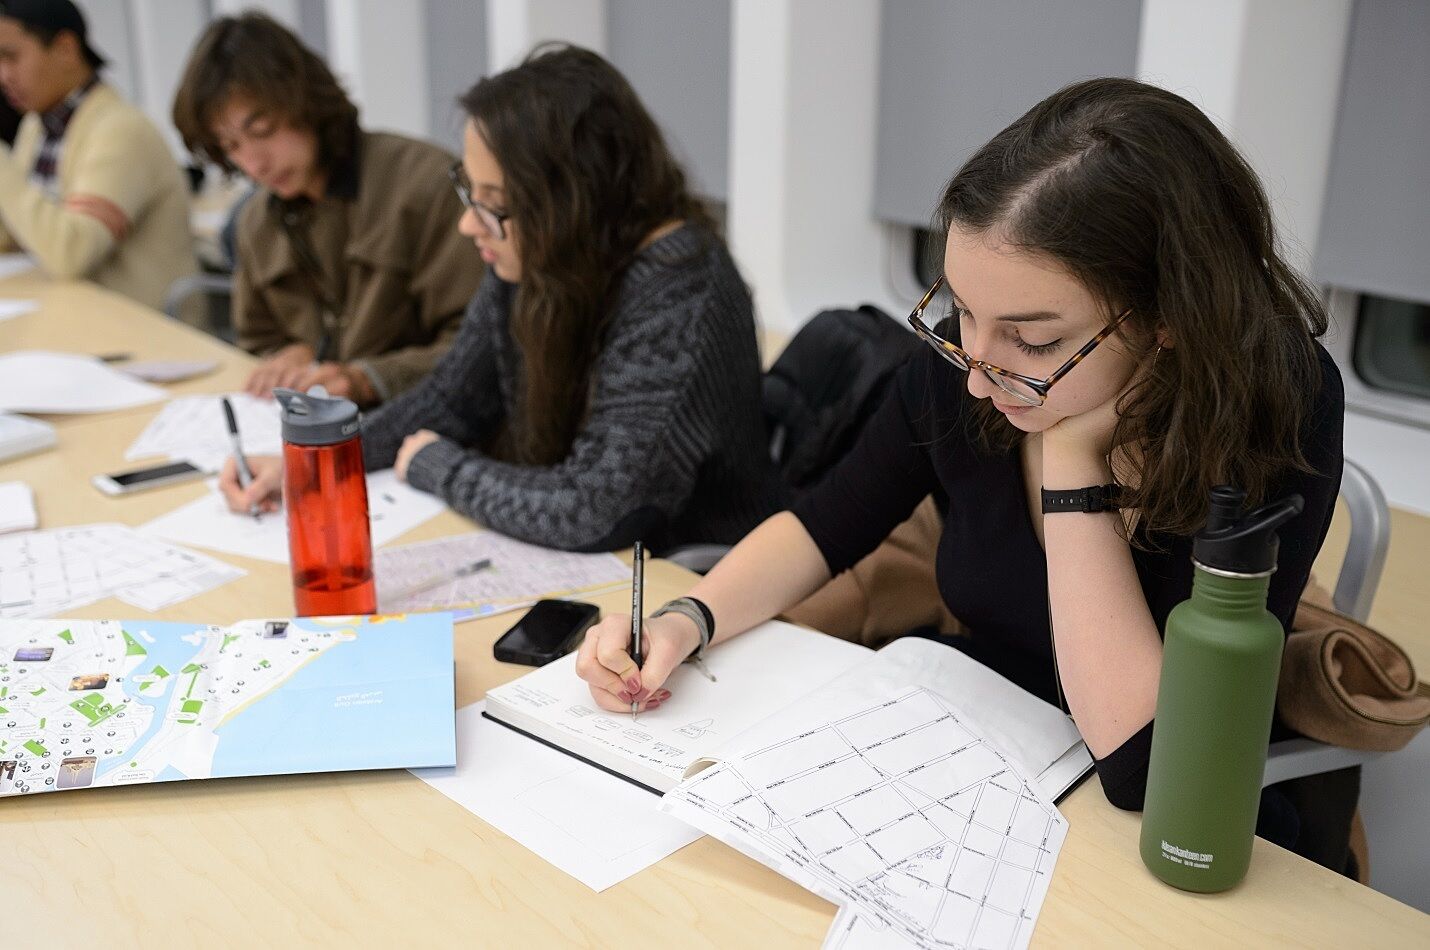
As we worked on our maps, Mogel guided us in conceptualizing and designing them. She urged us to think of a visual symbol to best support the story we wanted to tell through our maps. Ultimately, we hope to create a booklet with transparent pages. Each person’s map will be printed on a single page and will be stacked in a specific order to magnify relationships between the different topics.
By Jejomar, YI Leader


